 Blog building in-progress, come back again soon as updates are happening here.
How To: Kube-Prometheus-Stack on IKS
In the previous article I introduced the Kube-Prometheus-Stack and showed how easy it was to get full cassandra metrics collector stack running. In this article I am going to show how to easily apply this same stack in an IKS Cassandra Cluster. In order to complete this integration, I need to have an operational dev environment to prove the documented stack commands work. Next, I need to redploy my IKS Cass Cluster with a combination of original commands and new commands.
What is Kube-Prometheus-Stack?
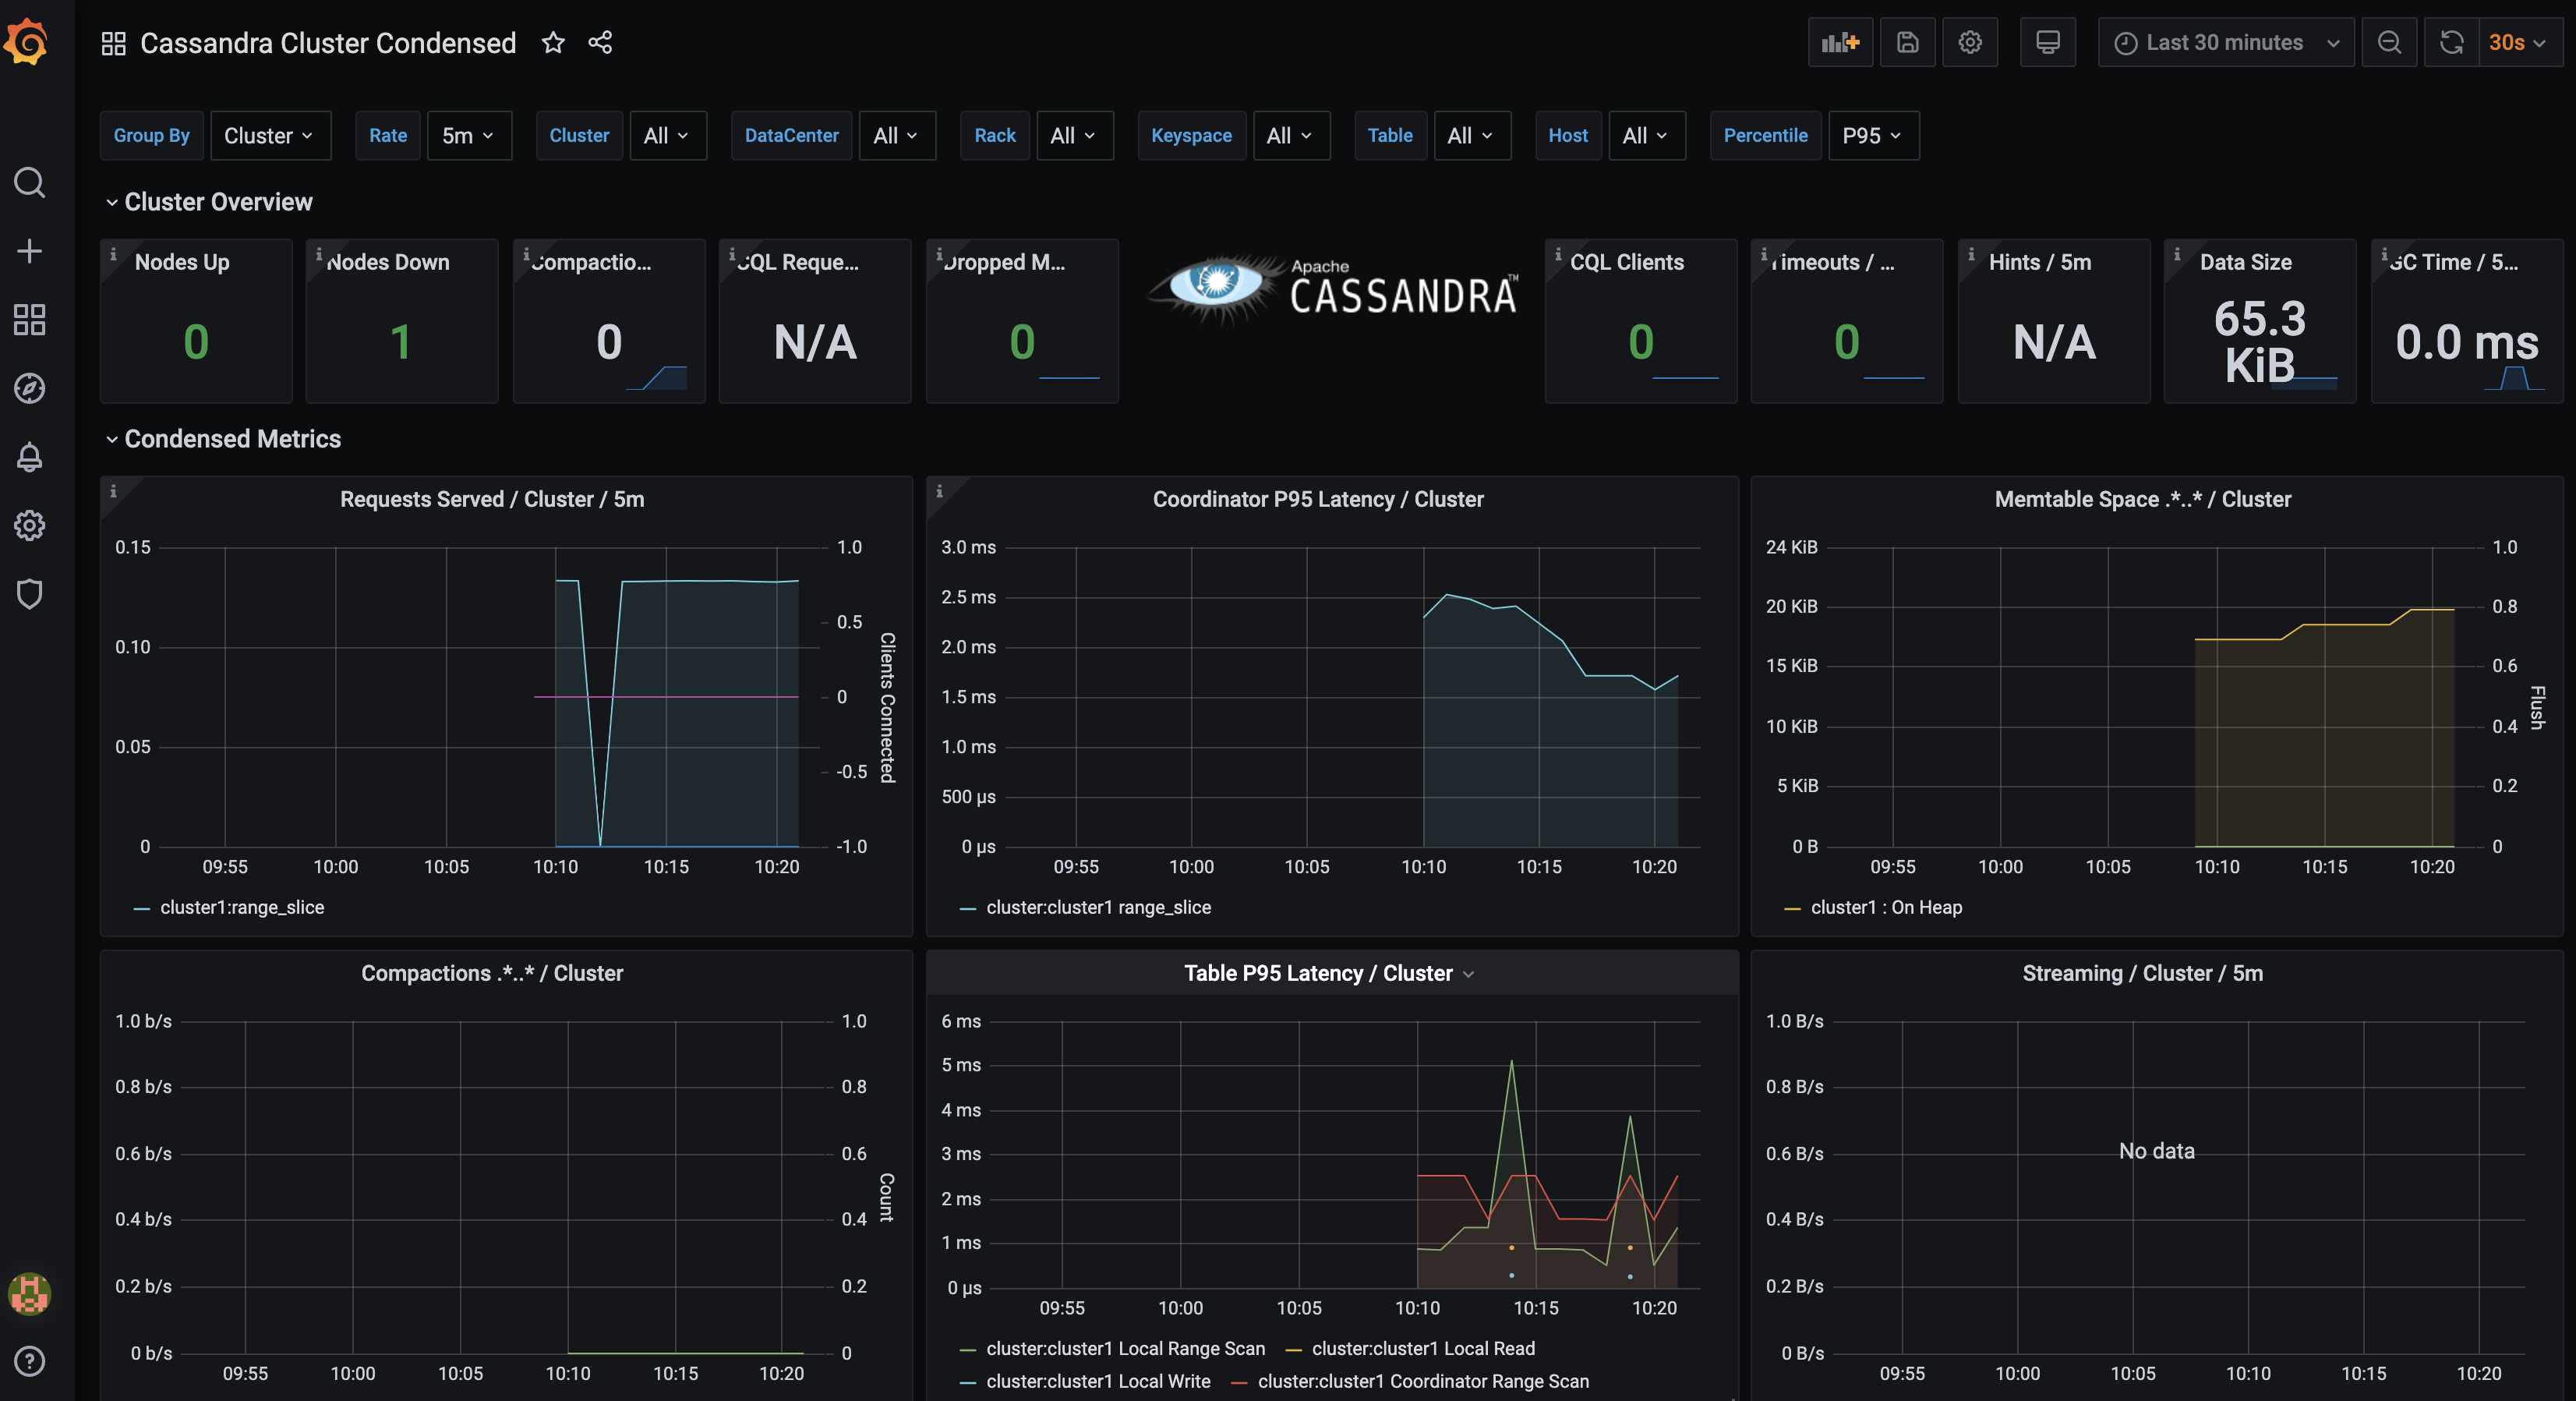
The kube-prometheus-stack is a helm chart that reduces the friction of manually installing Prometheus and Grafana, connecting to cassandra metrics collectors, and installing dashboards to view cassandra metrics. Thanks to my Cass-Op partner in crime bradfordcp we can find all of the sample files and documentation here. Using this K8s Cassandra Example I can quickly get a grafana dashboard hooked up to Cassandra Cluster Metrics.
What Commands Did I Run?
ibmcloud login -u steven.matison@datastax.com -p [password] -a cloud.ibm.com -r us-south -g Default
ibmcloud ks cluster config --cluster mycluster-dal12-b3c.4x16
helm repo add iks-charts https://icr.io/helm/iks-charts
helm repo update
helm install block-storage-plugin iks-charts/ibmcloud-block-storage-plugin
kubectl create -f https://raw.githubusercontent.com/ds-steven-matison/cass-operator/master/operator/k8s-flavors/iks/storage-block.yaml
cd ~/Documents/GitHub
git clone https://github.com/bradfordcp/k8s-cassandra-example.git
cd k8s-cassandra-example
helm repo add datastax https://datastax.github.io/charts
helm repo add prometheus-community https://prometheus-community.github.io/helm-charts
helm repo update
helm install monitoring prometheus-community/kube-prometheus-stack
helm install cass-operator datastax/cass-operator
kubectl get svc
kubectl apply -f cluster-iks.yaml
kubectl get pods --all-namespaces
kubectl create -f dashboards.configmaps.yaml
kubectl apply -f cluster.servicemonitor.yaml
kubectl get svc
helm template monitoring prometheus-community/kube-prometheus-stack -f monitoring.values.yaml
kubectl port-forward svc/monitoring-grafana 3000:80
kubectl port-forward svc/cluster1-dc1-all-pods-service 9042:9042
kubectl get secret -o yaml cluster1-superuser
kubectl exec -i -t -c cassandra cluster1-dc1-default-sts-0 -- cqlsh -u cluster1-superuser -p [password]
kubectl port-forward cluster1-dc1-default-sts-0 9042:9042
What Were The Sharp Edges?
- I needed to remove my old cass-operator and replace with new operator
- I needed to apply some changes to my cluster yaml (auth and prometheus configs)
- I needed to work in new environment test cycles with full fresh clusters to reduce friction from previous test cycles
What Are Lessons Learned?
- I learned to complete documented dev sample in simple k3ds environment and firmly know it works before attempting in other environments
- I learned to repeatedly monitor git repos documentations due to the rapid pace of Cass-Operator and Kube-Prometheus-Stack repo changes
- I learned all of the pieces required to wire cassandra metrics to promethesus and grafana
What Does Cluster Look Like?
The Kube Prometheus Stack installs bundle of Services and Pods that look like this:
NAME
monitoring-grafana
monitoring-kube-prometheus-alertmanager
monitoring-kube-prometheus-operator
monitoring-kube-prometheus-prometheus
monitoring-kube-state-metrics
monitoring-prometheus-node-exporter
prometheus-operated

default       alertmanager-monitoring-kube-prometheus-alertmanager-0
default       monitoring-grafana-6cf77745d9-jgm6t
default       monitoring-kube-prometheus-operator-556b86bc5d-db7pt
default       monitoring-kube-state-metrics-558bccc948-mdlkh
default       monitoring-prometheus-node-exporter-bdkpz
default       monitoring-prometheus-node-exporter-ddfsv
default       monitoring-prometheus-node-exporter-skwwb
default       prometheus-monitoring-kube-prometheus-prometheus-0
cluster-iks.yaml
apiVersion: cassandra.datastax.com/v1beta1
kind: CassandraDatacenter
metadata:
  name: dc1
spec:
  clusterName: cluster1
  serverType: dse
  serverVersion: "6.8.4"
  managementApiAuth:
    insecure: {}
  size: 3
  storageConfig:
    cassandraDataVolumeClaimSpec:
      storageClassName: server-storage
      accessModes:
        - ReadWriteOnce
      resources:
        requests:
          storage: 25Gi
  config:
    # Enable the DSE metrics collector, and stand up collectd for prometheus to scrape
    10-write-prom-conf:
      enabled: true
      port: 9103
      staleness-delta: 300
    cassandra-yaml:
      authenticator: org.apache.cassandra.auth.PasswordAuthenticator
      authorizer: org.apache.cassandra.auth.CassandraAuthorizer
      role_manager: org.apache.cassandra.auth.CassandraRoleManager
    jvm-server-options:
      initial_heap_size: "800M"
      max_heap_size: "800M"
      additional-jvm-opts:
        # As the database comes up for the first time, set system keyspaces to RF=3
        - "-Ddse.system_distributed_replication_dc_names=dc1"
        - "-Ddse.system_distributed_replication_per_dc=3"
What’s Next?
Stay tuned for more updates here for additional kubernetes cassandra operator topics as I dig in even more with the Datastax Cassandra Operator.
How can I help you with Kubernetes?

Find me over on the DataStax Community to ask me any questions about Cassandra and Kubernetes. Also let’s chat if you have something kewl you did with Cassandra and Kubernetes and you want me to feature it in my blog. Look below or to the right for more ways to find me.