 Blog building in-progress, come back again soon as updates are happening here.
How To: Install Kube-Prometheus-Stack
In the previous article I introduced the Cass Operator and then went deeper into the Cass Operator with IKS. While working with Prometheus and Grafana on IKS I ran into some sharp edges with connecting Cassanrda Metrics to Prometheus and Grafana. In this article I am going to show how to easily create the Kubernetes Prometheus Stack with everything completely wired up. With a working sample base, without conflicts between service names, pods, and cassandra it is now possible to better understand wiring this up manually.
What is Kube-Prometheus-Stack?
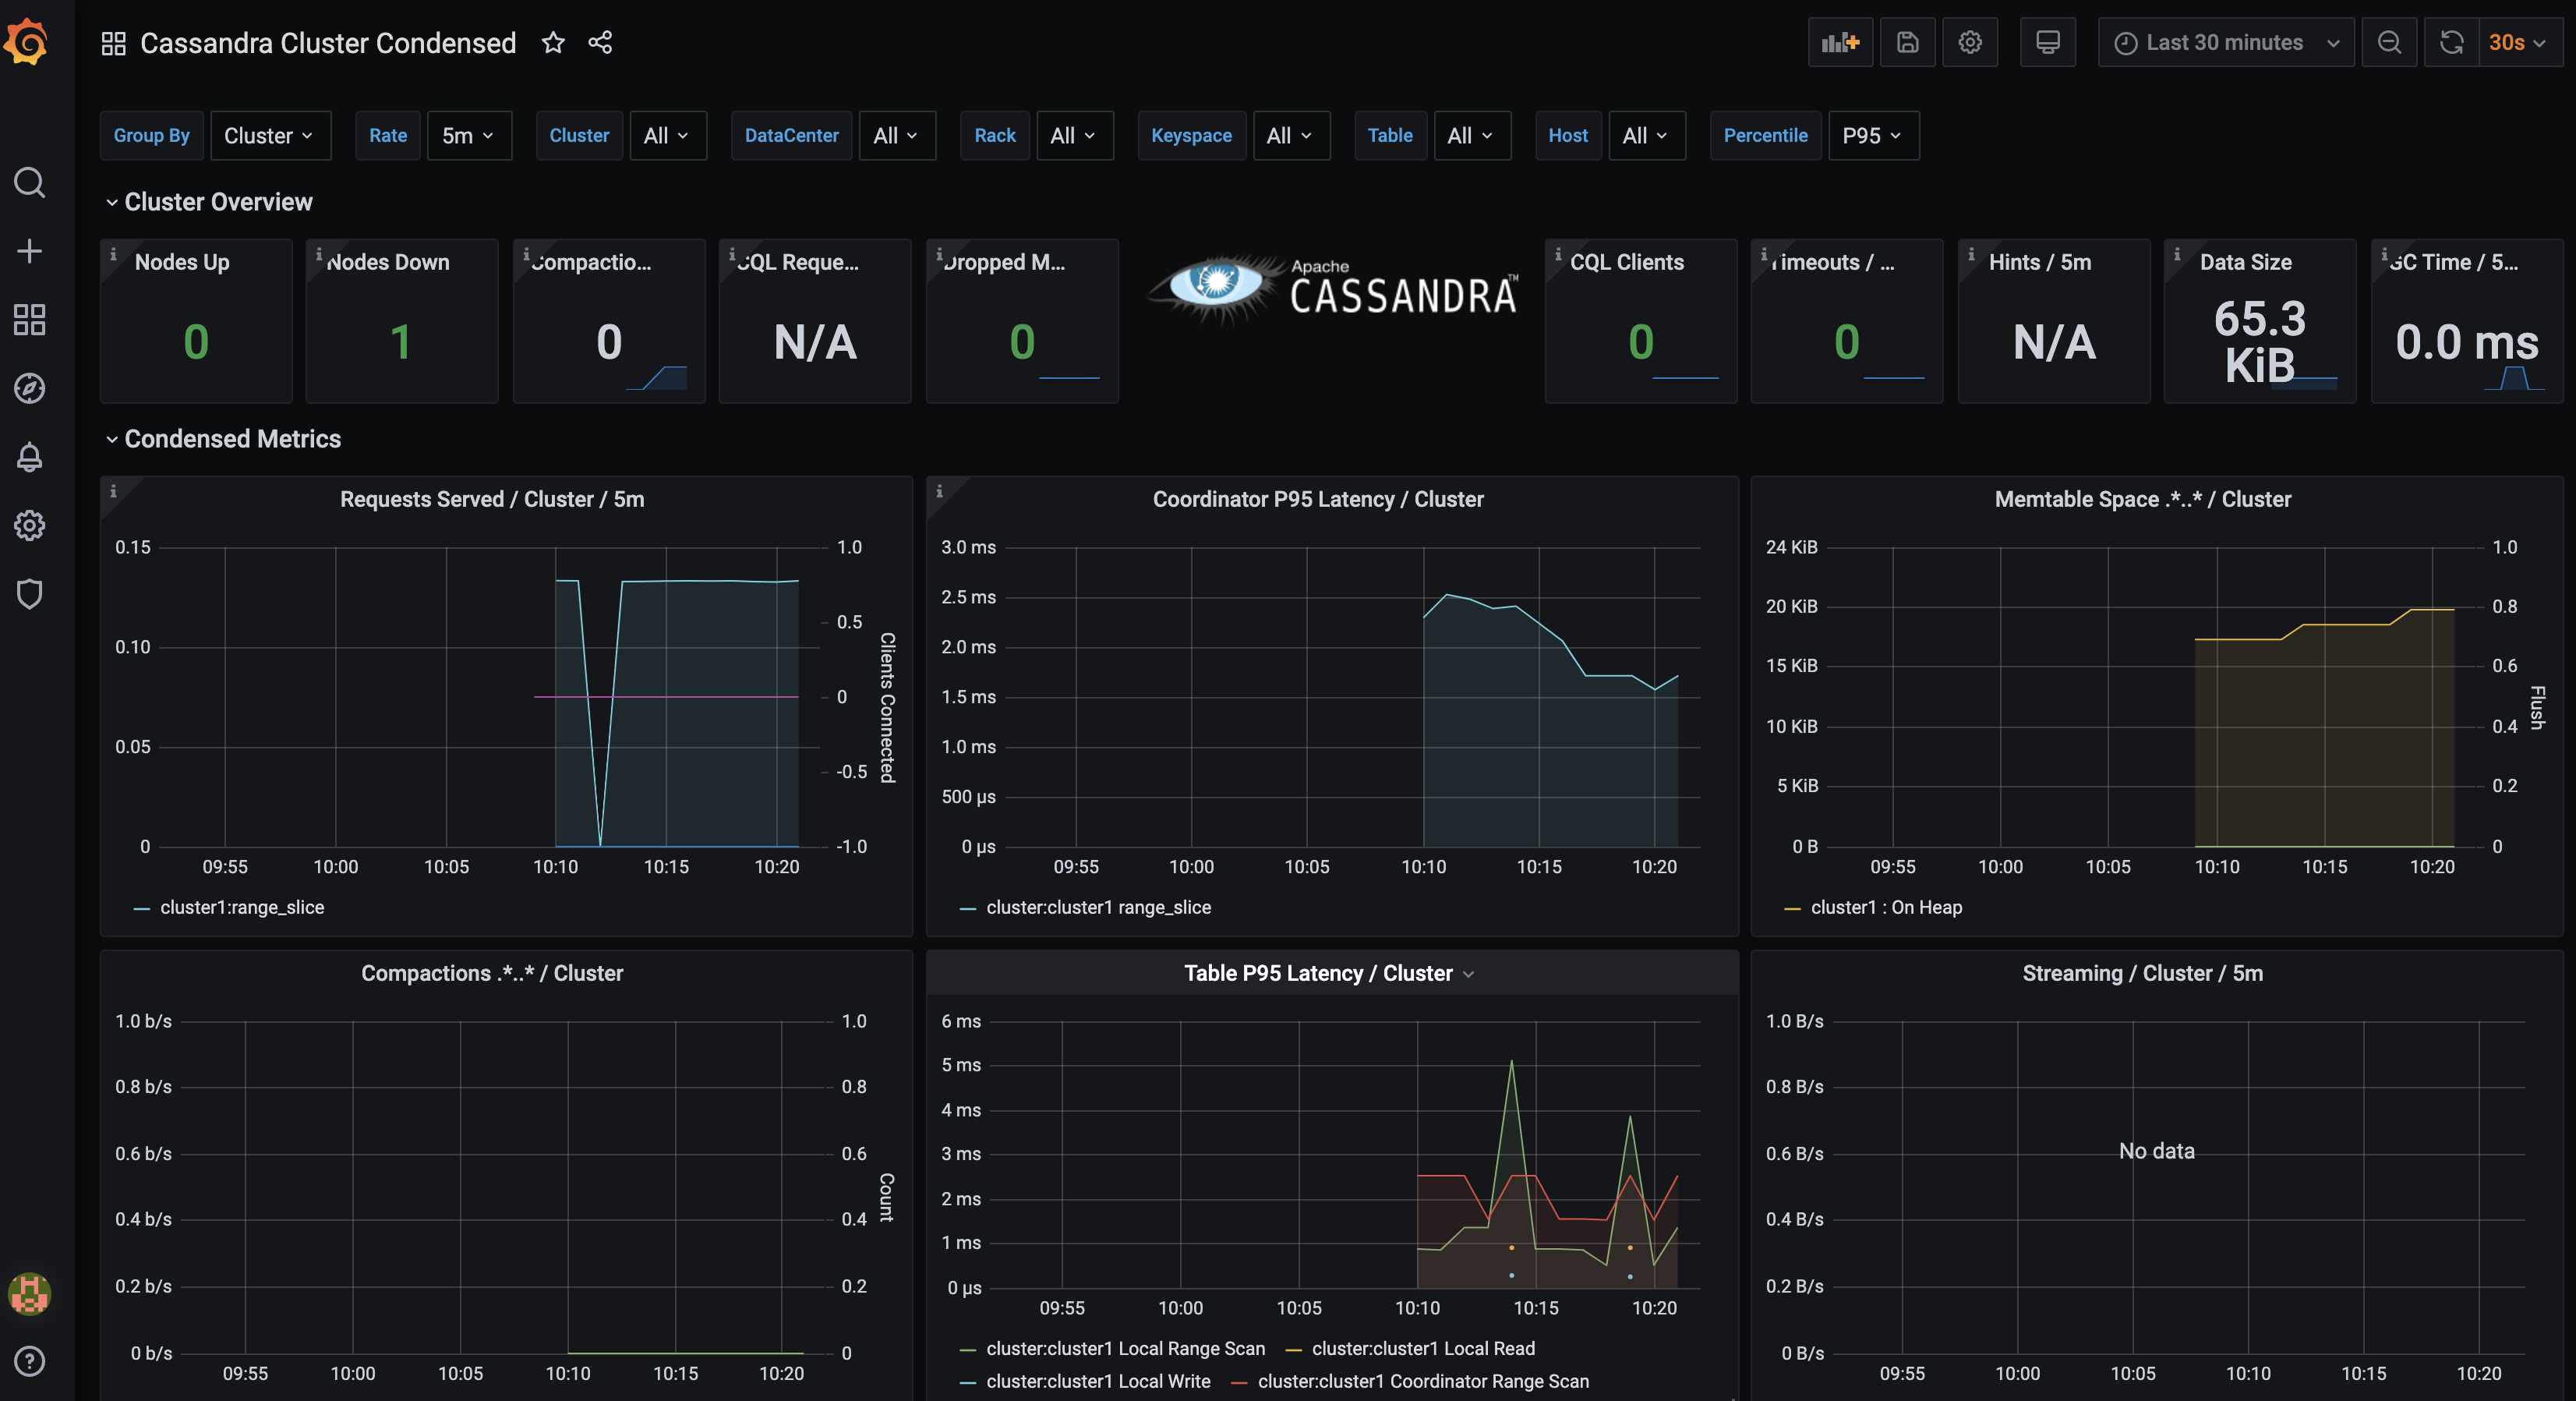
The kube-prometheus-stack is a helm chart that reduces the friction of manually installing Prometheus and Grafana, connecting to cassandra metrics collectors, and installing dashboards to view cassandra metrics. Thanks to my Cass-Op partner in crime bradfordcp we can find all of the sample files and documentation here. Using this K8s Cassandra Example I can quickly get a grafana dashboard hooked up to Cassandra Cluster Metrics.
What Commands Did I Run?
cd ~/Documents/GitHub
git clone https://github.com/bradfordcp/k8s-cassandra-example.git
cd k8s-cassandra-example
k3d cluster create
helm repo add datastax https://datastax.github.io/charts
helm repo add prometheus-community https://prometheus-community.github.io/helm-charts
helm repo update
helm install monitoring prometheus-community/kube-prometheus-stack -f monitoring.values.yaml
helm install cass-operator datastax/cass-operator
kubectl apply -f cluster.yaml
kubectl create -f dashboards.configmaps.yaml
kubectl apply -f cluster.servicemonitor.yaml
kubectl get svc
helm template monitoring prometheus-community/kube-prometheus-stack -f monitoring.values.yaml
kubectl port-forward svc/prometheus-operated 9090
kubectl port-forward svc/monitoring-grafana 3000:80
k3d cluster delete
What Were The Sharp Edges?
- I had to get the default admin password using base64 decode for values found in helm template command. BTW the password is prom-operator.
- No other issues. With k3d, docker, helm, and kube-prometheus-stack, this has zero friction.
What Are Lessons Learned?
- I learned that you can port forward against the svc without looking at pods to get the unique pod name.
- I learned that using different methods to install prometheus or grafana is confusing when it comes time to install the cassandra dashboard and wire to metrics.
- I learned how to create a simple base example others can use to help issues wiring existing prometheus and grafana to the grafana dashboard template.
What’s Next?
Stay tuned for more updates here for additional kubernetes cassandra operator topics as I dig in even more with the Datastax Cassandra Operator.
How can I help you with Kubernetes?

Find me over on the DataStax Community to ask me any questions about Cassandra and Kubernetes. Also let’s chat if you have something kewl you did with Cassandra and Kubernetes and you want me to feature it in my blog. Look below or to the right for more ways to find me.